FR
Feature Reduction
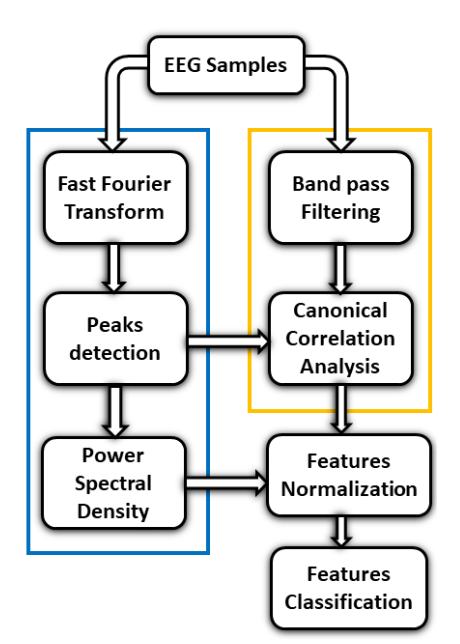
Fig 1 : Block diagram of the feature Reduction algorithm. The blue box and yellow box represent a processing conducted in frequency and time domains respectively. [1]
Frequency domain
The procedure in the frequency domain is shown in the blue box.
- A single-sided amplitude spectrum is obtained through Fast Fourier Transform.
- The interval 0.9fn, 1.1f~n was used to find the actual peak frequency fa (fn is the generic nominal frequency value).
- More Accurate Power Spectral Density coefficients are computed.
Time domain
The procedure in the time domain is shown in the yellow box.
- Bandpass Filtering is between 5 and 25 Hz.
- Canonical Correlation Analysis between the filtered signal and a set of sinewaves. Note: These sinewaves have the frequencies of the n detected peaks and variable phase.
References
A. Apicella et al., "Enhancement of SSVEPs Classification in BCI-Based Wearable Instrumentation Through Machine Learning Techniques," in IEEE Sensors Journal, vol. 22, no. 9, pp. 9087-9094, 1 May1, 2022, doi: 10.1109/JSEN.2022.3161743. ↩︎