Methodology
Goals
Building upon prior work on passive EEG-neurofeedback using the n-back task[1] is the goal via using an interactive, head-mounted VR experience. As mentioned in the Introduction, an attempt to move beyond controlled and sterile experimental environments has been made, as real environments might distract and the user.
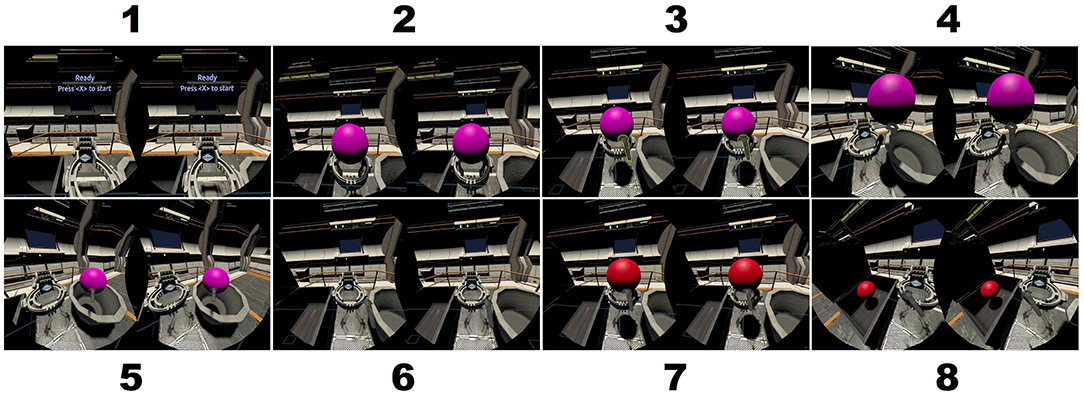
In order to module cognitive workload, the n-back task[2] to modulate cognitive workload has been chosen. The experiment will be using the HTC VIVE VR headset[3] and participants are presented with a series of symbols and are asked to physically interact with objects to perform a task(further elaborated in the Methodology section). In this case, the stimuli were a series of colored balls presenteed on a virtual podium as shown in Figure 1 to emulate a more immersive and intentionally game-like environment.
Although closed-loop BCI is not implemented here, the goal is to integrate EEG-based feedback into future interactive VR systems.
Materials and Methodology
Participants and Experimental Setup
A total of fifteen participants from age 18 to 35, with their mean being 24.73, with 4 females and everyone being right-handed have taken part in the study. This has also been approved by the Institutional Review Bord of Old Dominion University.
All participants first went through an informed consent form, followed by a visual acuity test. Then they went through the Motion Sickness Susceptibility Questionnair short-form(MSSQ-short[4]). Lastly, after going through the Ishihara Color Blindness test[5], all participants satisfied the inclusion criteria. They had around 20/30 line on the visual acuity test, at least 19 on the MSSQ correctly and determined all symbols on the color-blindness test.
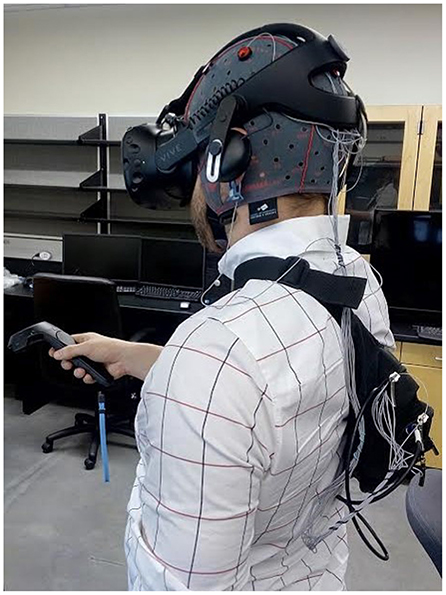
As mentioned earlier, for the VR headset, the HTC VIVE has been chosen and primarily consists of a motion-tracked headset display, two motion-tracked hand controllers and two 'lighthouse' base stations, capable of providing 6 degree of freedom(6DOF) tracking. After screening, the EEG cap was placed on the participant's head and the EEG electrodes were filled with electrolyte gel. The electrode cap was then covered with a protective plastic hair dressing cap to insure that the gel did not seep onto the VR headset. The VR headset was then positioned over the EEG cap. Finally, a wireless EEG amplifier was placed in a shoulder strap on the participants back.
The configuration of the experimental equipment on a participant, excluding the protective plastic hair dressing cap, is shown in Figure 2. After setting up the equipment, participants grabbed a VIVE hand controller in the dominant hand, i.e. the right hand in this case. Before starting the experiment, participants were placed in a standing position approximately 1m in front of the recording computer, within the VR workspace.
Experimental Task
Within the experiment, the participants were shown a series of colored balls presented on a virtual podium in the VR environment. Following [6], each ball is colored red, blue, purple, green or yellow. A ball receptacle is placed to the right and left of the participant in the VR environment and the target receptacle was shaped like a treasure chest. For each run, the goal was to pick up the ball from the podium and put it in the target receptacle if the ball's color matched the color of the ball n trials back. Otherwise, the ball would go to the opposite receptacle, as shown in the screencaptures in Figure 2.
Participants did a 5 minute practice run to familiarize themselves with the VR system and the n-back task. During practice, the participants perfoormed the 1-back task until one run consisting of a random sequence of 2 balls was completed without any errors. Following the practice, they then went on to perform a series of three experimental runs in randomized order(0-back, 1-back, 2-back). The 0-back task simply asked the participant to determine whether the ball was red or not.
For each run, the participants received specific instruction regarding the task, followed by 4 experimental runs of the same n-back task. Each of which consisted of a random sequence of 20 balls and they would only remain visible for 4 seconds. Immdediately after the time span, the onset of the next ball followed. During the experiment, only a single ball is displayed at any given moment and an auditory tone signaled the appearance of each new ball. The colors were generated randomly such that a minimum of 2 target trials were present in the run.
The order of the experimental runs were counterbalanced across participants, which meant that for each participant, the target receptacle locations were swapped to avoid biases that may be created by the lateral movements. To engage participants, the performance score, i.e. the percentage of correctly placed balls was shown after each trial. The total duration of the experiment was kept to 20 minutes. This was to reduce the risk of simulator sickness and meant that the time between successive experiments and runs were less than a minute.
The empirical number of targets within a run was 7 and the participants were required to respond to all balls in each experimental run. If they failed to do so, resets would occur and said run would be repeated. Resets occurred during the practice for several participants, but only for one during the actual experimental runs.
Data Collection & Analysis
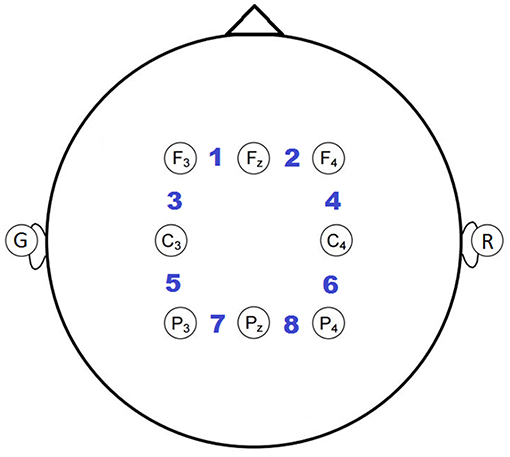
Each participant wore an 8-channel electrode cap(g.LADYBIRD[7]) with active electrodes positioned based on the international 10-20 system[8]. Specifically F3, Fz, F4, C3, C4, P3, Pz, P4 were used, as shown in Figure 3. This was based on neural activation from prior EEG and fMRI studies[9][1:1]. The EEG was collected using an 8-channel wireless biosignal amplifier(g.MOBIlab[7:1]), which was grounded to the left earlobe and referenced to the right earlobe, while being digitized at a 256 Hz. The position of the VR headset and the controller were also tracked and digitized at 32Hz. Communication between the VR software(developed in Unity[10]) and the BCI2000 EEG recording software was performed via UDP communication using the BCI2000 application connector[11].
Bipolar reference was used, due to it empirically minimizing the correlation of high frequency activity. Such activities were assumed to be caused by scalp muscle tension(frontalis, temporalis, occipitalis), while the task is compared to an ear or common-average reference. Eight bipolar channels were extracted by subtracting the adjacent earlobe-referenced channels from right to left and anterior to posterior, as indicated by the numbered positions in Figure 3.
Furthermore, a conservative Hampel outlier filter[12] was applied to the EEG to reduce the occasional impulse-like artifact due to the wireless transmission. It computes the median of a sliding 1-second window centered on the current sample. The median absolute deviation is then computed over the window and if the absolute deviation was greater than 5*σ, then it is replaced with the median. The processed EEG was visually inspected to verify the efficacy of the artifact removal.
EEG data was segmented by 4-second trials, yielding 240 total trials(4 runs × 3 conditions × 20 balls per run) per participant. Unfortunately, the last trial of each run had to be excluded from analysis, due to a software issue that prematurely terminated data collection, which resulted in 228 total trials per participants. In the end, all trials, i.e. correct and incorrect placements were included in the analysis.
| θ | α | β | γ |
|---|---|---|---|
| 5-7 Hz | 8-14 Hz | 15-30 Hz | 31-55 Hz |
The frequency spectrum of the EEG was computed for each 4s run using Welch's method with a 256-point FFT and 50% overlap. The resulting spectral amplitudes were log transformed and the spectral bins were averaged over the traditional EEG bands. Since frequencies below 5Hz are prone to gross movement artifacts, they were excluded from the analysis, while the higher frequency range, named HF(70-100Hz), was analyzed. This frequency band was shown to be correlateed with the task and is outside the frequency range of the typical scalp EEG. As mentioned before, task-dependent variations of this band are suspected to be modulated in-part by subtle scalp muscle tension as suggested in [13].
HF Suppression
Since EMG activity is broadband and likely also pervades the low-frequency bands[14][15][16][17][18], a linear regression model was applied to reduce the correlation of this high-frequency activity in the lower frequency bands. Using trial-wise spectral amplitude of each lower frequency band as the regressand and the HF-band as spectral amplitude as the regressor, a regression model was obtained. Then, said model was used to remove correlated activity by subtracting the model output from the respective regressand, and this approach was referred to as HF-suppression by the authors.
Data was parsed according to n-back level and the Spearman's correlation was computed between thee n-back level and the spectral amplitude for each frequency band and bipolar channel. This was done in order to explore explore univariate characteristics of each spectral feature, as well as to quantify the relationship between the univariate spatio-spectral features and the cognitive workload level. Additionally, to explore multivariate discriminative power of spatial and spectral features, various combination of the features(5 spectral bins × 8 channels) were classfied using regularized LDA with four-fold cross-validation(number of trials is perfectly divisible by 4). The HF-suppression approach was applied to the training data for each fold and the fitcdiscr function in MATLAB was used to perform the rLDA and to optimize the regularization parameters. The suppression was also applied separately on the test data for each fold.
Brouwer, A.-M., Hogervorst, M. A., van Erp, J. B. F., Heffelaar, T., Zimmerman, P. H., and Oostenveld, R. (2012). Estimating workload using EEG spectral power and ERPs in the n-back task. J. Neural Eng. 9:045008. doi: 10.1088/1741-2560/9/4/045008 ↩︎ ↩︎
Kirchner, W. K. (1958). Age differences in short-term retention of rapidly changing information. J. Exp. Psychol. 55, 352–358. doi: 10.1037/h0043688 ↩︎
Golding, J. (2006). Predicting individual differences in motion sickness susceptibility by questionnaire. Pers. Ind. Diff. 41, 237–248. doi: 10.1016/j.paid.2006.01.012 ↩︎
Clark, H. J. (1924). The ishihara test for color blindness. Am. J. Physiol. Opt. 5, 269–276. ↩︎
McMillan, K. M., Laird, A. R., Witt, S. T., and Meyerand, M. E. (2007). Self-paced working memory: validation of verbal variations of the n-back paradigm. Brain Res. 1139, 133–142. doi: 10.1016/j.brainres.2006.12.058 ↩︎
Sharbrough, F., Chatrain, C. E., Lesser, R. P., Luders, H., Nuwer, M., and Picton, T. W. (1991). Amearican Electroencephalographic Society guidelines for standard electrode position nomenclature. J. Clin. Neurophysiol. 8, 200–202. doi: 10.1097/00004691-199104000-00007 ↩︎
Owen, A., McMillan, K., Laird, A., and Bullmore, E. (2005). N-back working memory paradigm: a meta-analysis of normative functional neuroimaging studies. Hum. Brain Mapp. 25, 46–59. doi: 10.1002/hbm.20131 ↩︎
Schalk, G., McFarland, D. J., Hinterberger, T., Birbaumer, N., and Wolpaw, J. (2004). BCI2000: a general-purpose brain-computer interface (BCI) system. IEEE Trans. Biomed. Eng. 51, 1034–1043. doi: 10.1109/TBME.2004.827072 ↩︎
Hampel F. R., ”The influence curve and its role in robust estimation,” Journal of the American Statistical Association, 69, 382–393, 1974 ↩︎
Mühl, C., Jeunet, C., and Lotte, F. (2014). EEG-based workload estimation across affective contexts. Front. Neurosci. 8:114. doi: 10.3389/fnins.2014.00114 ↩︎
Goncharova, I. I., McFarland, D. J., Vaughan, T. M., and Wolpaw, J. R. (2003). EMG contamination of EEG: spectral and topographical characteristics. Clin. Neurophysiol. 114, 1580–1593. doi: 10.1016/S1388-2457(03)00093-2 ↩︎
Fu, M. J., Daly, J. J., and Cavuşoǧlu, M. C. (2006). A detection scheme for frontalis and temporalis muscle EMG contamination of EEG data. Conf. Proc. Annual IEEE Eng. Med. Biol. Soc. 1, 4514–4518. doi: 10.1109/IEMBS.2006.4398455 ↩︎
Muthukumaraswamy, S. D. (2013). High-frequency brain activity and muscle artifacts in MEG/EEG: a review and recommendations. Front. Hum. Neurosci. 7:138. doi: 10.3389/fnhum.2013.00138 ↩︎
Yilmaz, G., Ungan, P., Sebik, O., Ugincius, P., and Türker, K. S. (2014). Interference of tonic muscle activity on the EEG: a single motor unit study. Front. Hum. Neurosci. 8:504. doi: 10.3389/fnhum.2014.00504 ↩︎
Janani, A. S., Grummett, T. S., Lewis, T. W., Fitzgibbon, S. P., Whitham, E. M., DelosAngeles, D., et al. (2017). Evaluation of a minimum-norm based beamforming technique, sloreta, for reducing tonic muscle contamination of EEG at sensor level. J. Neurosci. Methods 288, 17–28. doi: 10.1016/j.jneumeth.2017.06.011 ↩︎