BCI Seminar Presentation W3LB
Acrophobia Quantified by EEG Based on CNN Incorporating Granger Causality
The Paper "Acrophobia Quantified by EEG Based on CNN Incorporating Granger Causality"[1] written by Fo Hu, Hong Wang, Qiaoxiu Wang, Naishi Feng, Jichi Chen and Tao Zhang, published 23 December 2020 introduce a new method to quantify acrophobia into two or three different states based on brain activity measured by EEG.
To predict the state of acrophobia of a test subject the EEG signals are first processed by a Granger Causality analysis whose output matrices are then upscaled and input into a Convolutional Neural Network to extract representative features to classify the state of acrophobia. The study encompassed data from 51 subjects using Virtual reality to safely expose them to acrophobia in a virtual environment.
This method shows very high accuracy compared to other methods, reaching a 99.07% accuracy for the two-class classification task.
Motivation
Acrophobia is very subjective and thus hard to correctly quantify, however exact assessment is necessary to prevent danger and to apply therapy. Current assessments consist of either written self tests where subjects tend to overestimate the state of their acrophobia (or confuse acrophobia with Vertigo). Therefore if it is possible to create a quick and highly accurate assessment using an experiment in a safe virtual environment would be very helpful for therapy.
Experiments
To generate data to train the classifier the study has chosen 51 subjects who were exposed to a scenario of a construction site in a virtual reality environment while EEG data was measured as well as respiratory rate data. The scenario consists of multiple stages, first on the ground and then on a plank high in the air.
Subjects
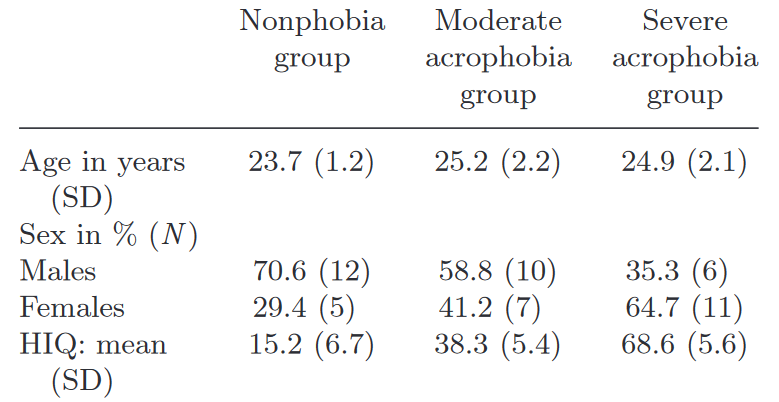
The authors recruited 51 subjects via the Northeastern University (NEU, China) Forum website. None of them had any neural or heart diseases, no drug dependencies and no uncorrected visual impairments. As seen in Figure 1 28 of the 51 subjects were males aged
Virtual Reality Environment
Using a head mounted VR device (Oculus Rift DK2) the subjects were exposed visually and aurally to a virtual environment of a construction site build and rendered by the authors using the Unity 3D game engine. During the exposure a biofeedback device (SCHUHFRIED Biofeedback 2000 X-pert) was used to collect respiratory rate data and EEG acquisition equipment (NeuroScan, Inc., El Paso, TX, USA) was used to capture the EEG signals.
The virtual world consisted of a modern city construction site of a partially finished building. Outside of the building is an elevator which leads to a plank leaning outside the building.
Experimental Procedure
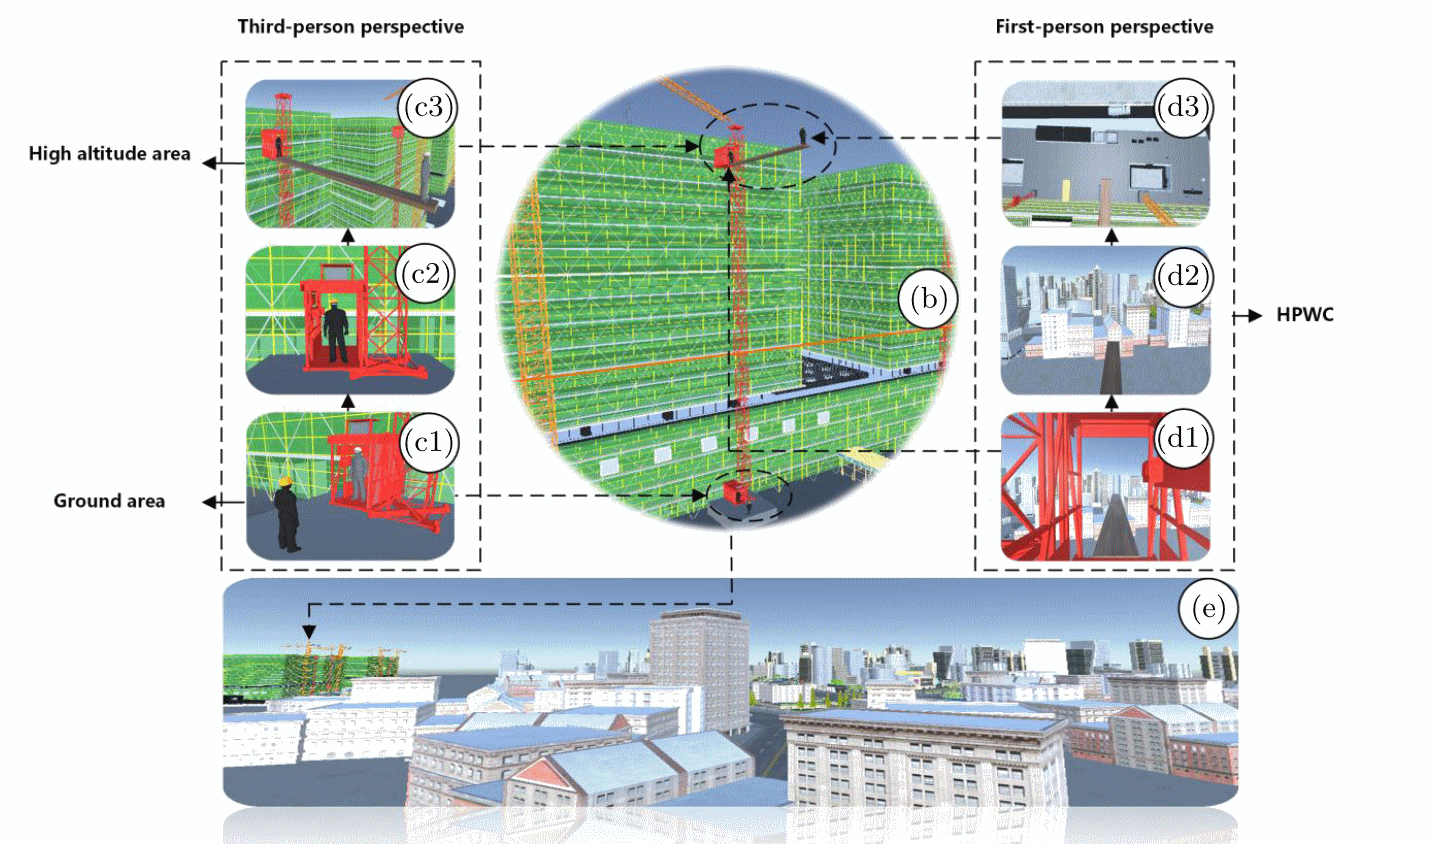
The exposure itself can be divided into four stages. In the first stage (SG, stand on grounyd, Figure 2-(c1)) the subjects were asked to stand on the ground for 20 seconds while hearing appropriate sounds from the surroundings (driving sounds, wind noises, etc.). In the second stage subjects rode an elevator to the upper floor of a building (Figure 2-(c2)). To increase immersion in the virtual environment the subjects had to manually interact with the environment like finding and pressing elevator buttons. The third stage is were the actual exposure to acrophobia begins. In this stage the subjects were asked to walk to the end of the plank (Figure 2-(c3, d1, d2)) and gaze down (Figure 2-(d3)), thus entering the fourth stage (SP, stand on plank) during which EEG and respiratory rate data was collected over a course of 4 minutes. Stages 2-4 can be summarized as the High-altitude Plank Walking Challenge (HPWC). During SG and SP eye and hand movements were avoided as much as possible to reduce artefacts in the data.
After completing the challenge the subjects were asked to fill out a height interpretation questionaire (HIQ) to determine presence and severity of their acrophobia.
Data Collection and Preprocessing Methods
During Phases SG and SP respiratory rate and EEG data were acquired and processed separately. The 30 EEG channels, arranged using the 10-20 Standard, were amplified (using a 40 channel NuAmps amplifier, NeuroScan, Inc., El Paso, TX, USA, with Ag-AgCl Scalp electrodes) and saved with a sampling rate of 1000 Hz. From the SP Phase only the middle 220 seconds were used for further processing to ensure data quality. A bandpass filter was applied to the data ranging from 0.01 Hz to 48 Hz to remove noise. Special attention was paid to the power line interference using a 50 Hz Notch filter.
Further Processing with the Brainstorm software program which is a toolbox in MATLAB included a Baseline correction using the mean of the data from the SP and an Independent Component Analysis, to reject movement artefacts.
The respiratory rate data was recorded at a sampling rate of 100 Hz and thus sampled up to 1000 Hz to match the EEG data. It was baseline corrected similar to the EEG data by subtracting the mean of the 220 seconds during SP from the data itself.
Next the data was cleaned, which is necessary, because the subjects could not maintain a single state of acrophobia during the entire 220 seconds. Thus wrongly labeled data or invalid data was removed. The respiratory rate data was used to filter out wrongly labeled EEG data. It was first downsampled into 5 second windows, afterwards using the distribution of root-mean-squared-values an upper and lower bound was established and EEG data during the outliers removed.
Out of the 51 subjects the EEG data from 39 subjects was used as a trainings set, of which 13 belonged to each class of acrophobia. The data from the remaining 12 were used as a test set. The EEG data was segmented into non overlapping five second epochs, resulting in 1716 epochs for the 39 subjects out of which 1650 were used in training the classifier.
Structure of the Classifier
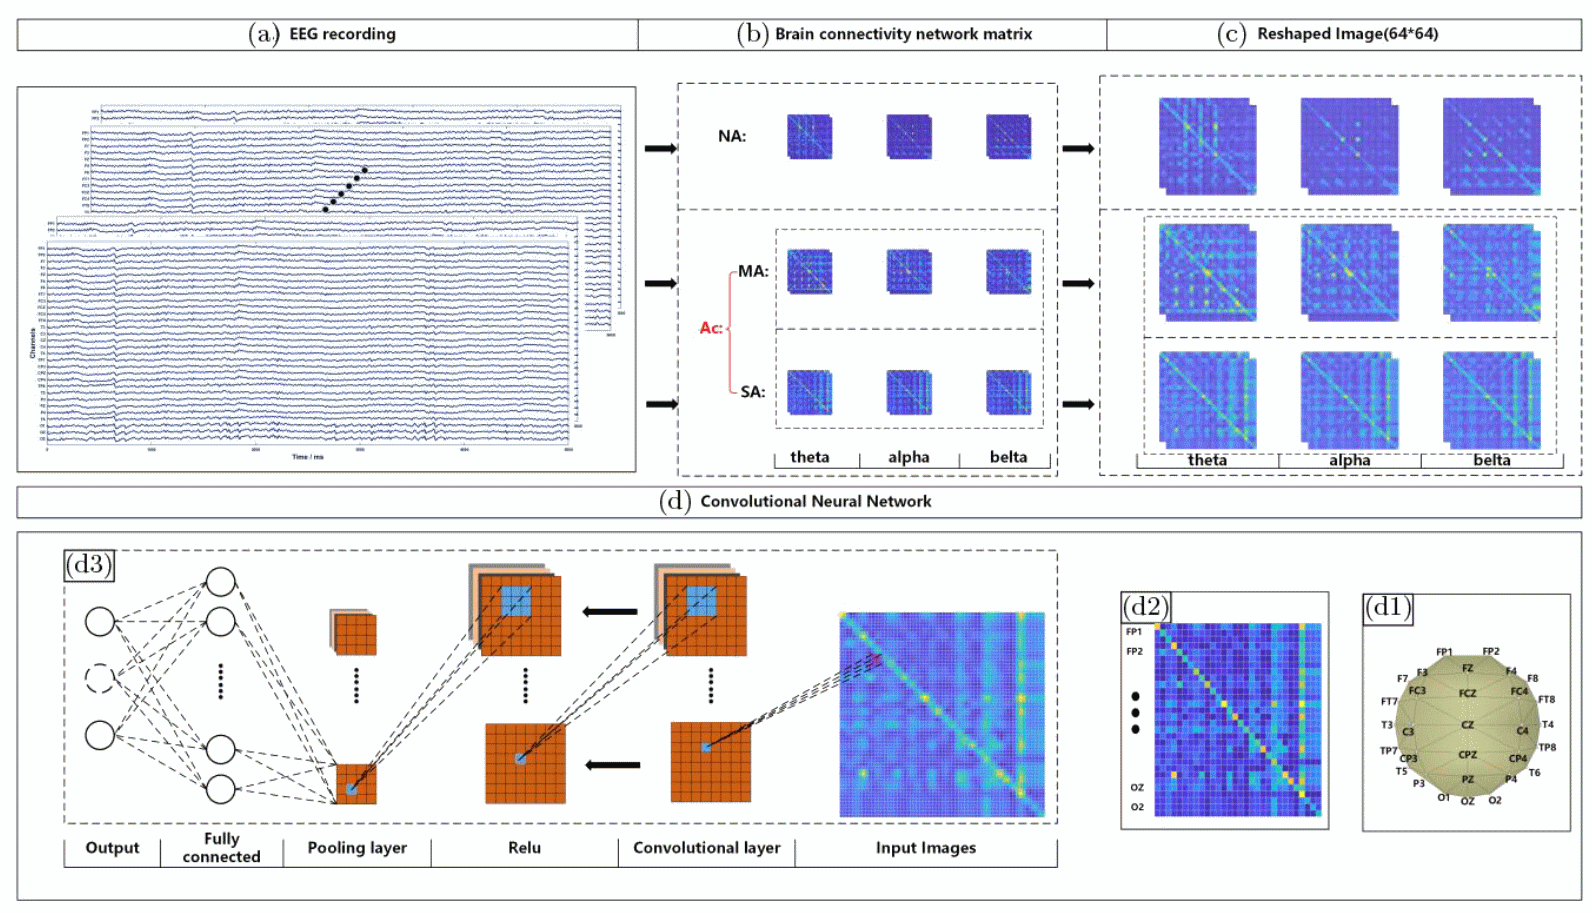
To classify the EEG data into either two classes (no acrophobia vs acrophobia) or three classes (no acrophobia vs mild acrophobia vs severe acrophobia) each epoch of the EEG data was first bandpass filtered three times separately to extract the theta (4-7 Hz), alpha (8-13 Hz) and beta (13-30 Hz) frequency bands (Figure 3-(a)). Each set of EEG data was then reduced into a
Granger^\epsilon = log(Granger' + \epsilon)
Architecture of Convolutional Neural Network
The input of the convolutional network are the upscaled
Training
The model was trained using five-fold cross-validation. Training time of one fold for the two class seperation task was approximately 231 seconds while it took 312 seconds to train one fold of the three class seperation task. Applying the classifier to one epoch takes around 100 milliseconds, which fulfills the requirement for an excellent online recognition system [3].
Results and comparison to other models
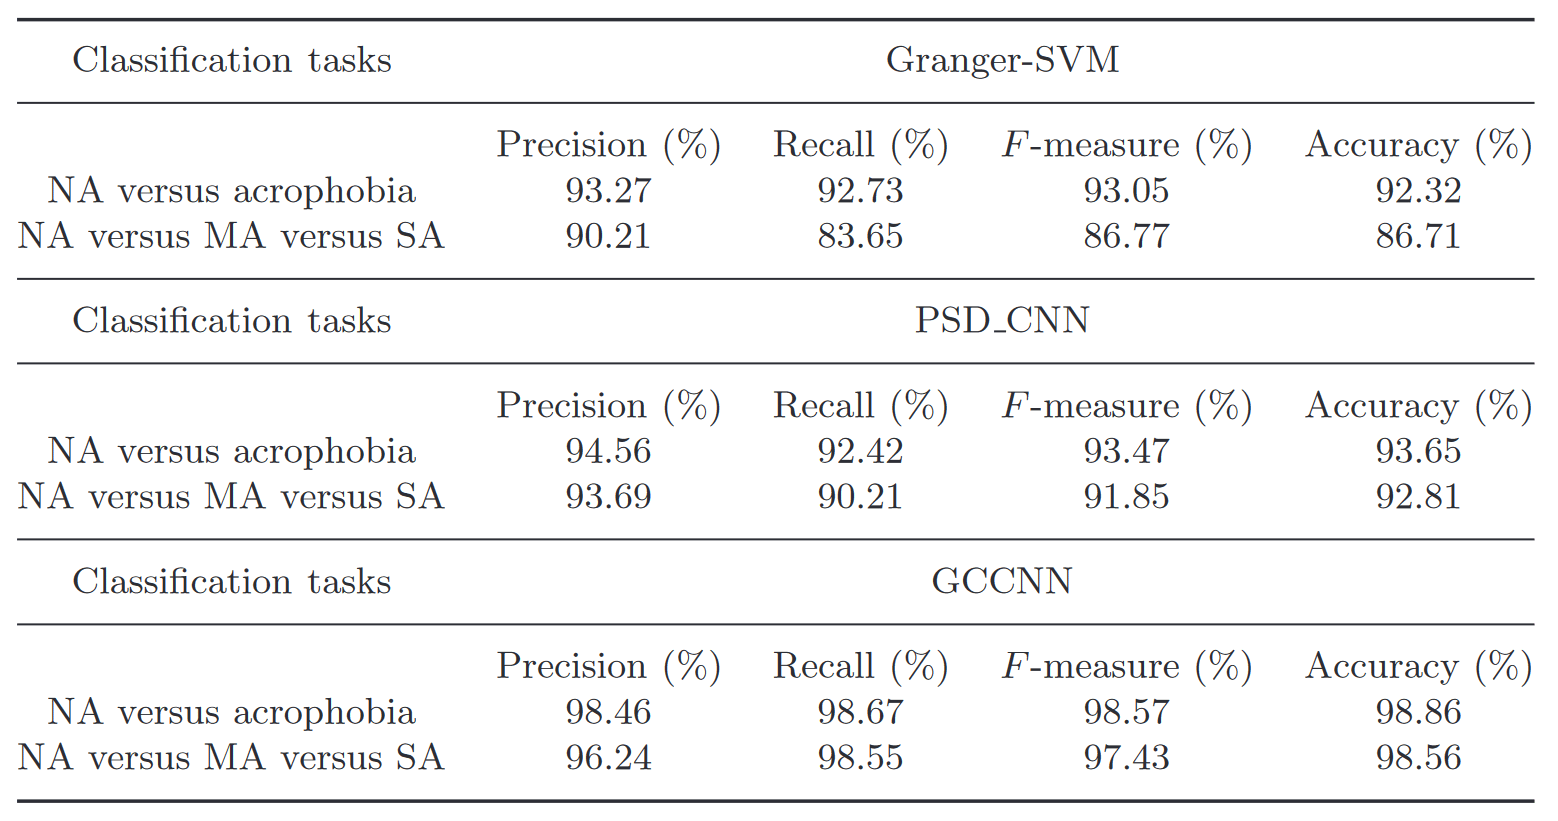
The model was evaluated for two-class (no acrophobia, acrophobia) and three-class (no acrophobia, mild acrophobia, severe acrophobia) classification. To evaluate performance two other models were used as a comparison, the first first applies a power spectrum density analysis on the EEG-data and followed by a similarly structured Convolutional Neural Network afterwards (PSD-CNN), the second one uses the same Granger causality Analysis which results where then fed into a Support-Vector Machine (GC-SVM), but due to this model performing much worse than the others only limited discussion including it was done. The results are shown in Figure 4, where the GCCNN has by far the best classification performance of the three models, followed by the PSDCNN. The Granger-SVM model has a much lower perfomance than the other two.
Classification metrics
The authors used different metrics to evaluate the performance of their model. They are all based on the rate of true positives
- Precision(Pre): How many samples out of all positively classified samples were classified correctly as a positive sample (
\frac{TP}{TP+FP} ). - F-Measure: Measure of Accuracy in a statistical test, see also F-Score (
2 \cdot \frac{Pre \times Re}{Pre + Re} ). - Recall(Re): How many samples were correctly classified as positive out of all positive samples (
\frac{TP}{TP+FN} ). - Accuracy: How many samples were correctly classified (
\frac{TP+TN}{TP+TN+FP+FN} ).
Different CNN-Architectures
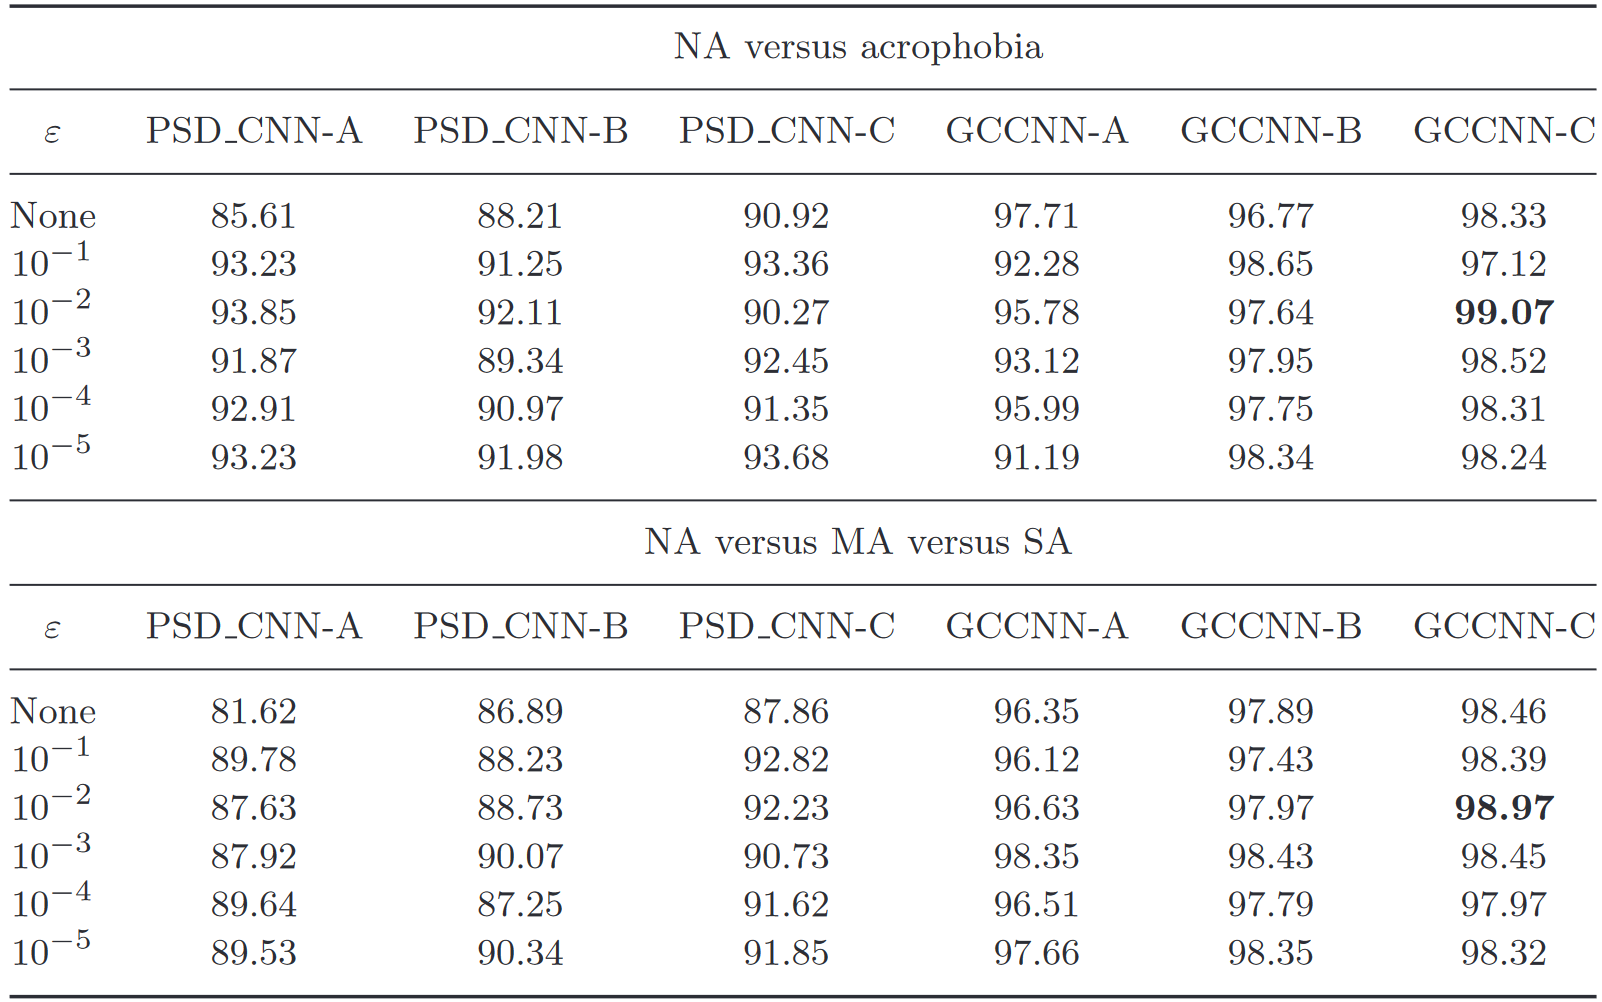
The authors of the paper created three different CNN-architectures to evaluate performance for both the PSD-CNN model and their own model. The best performing one achieving a recall of 98.97% recall in the three-class separation and a 99.07% recall in the two-class separation task, as seen in Figure 5. Only the best performing architecture was implemented as described above.
Visualization of features
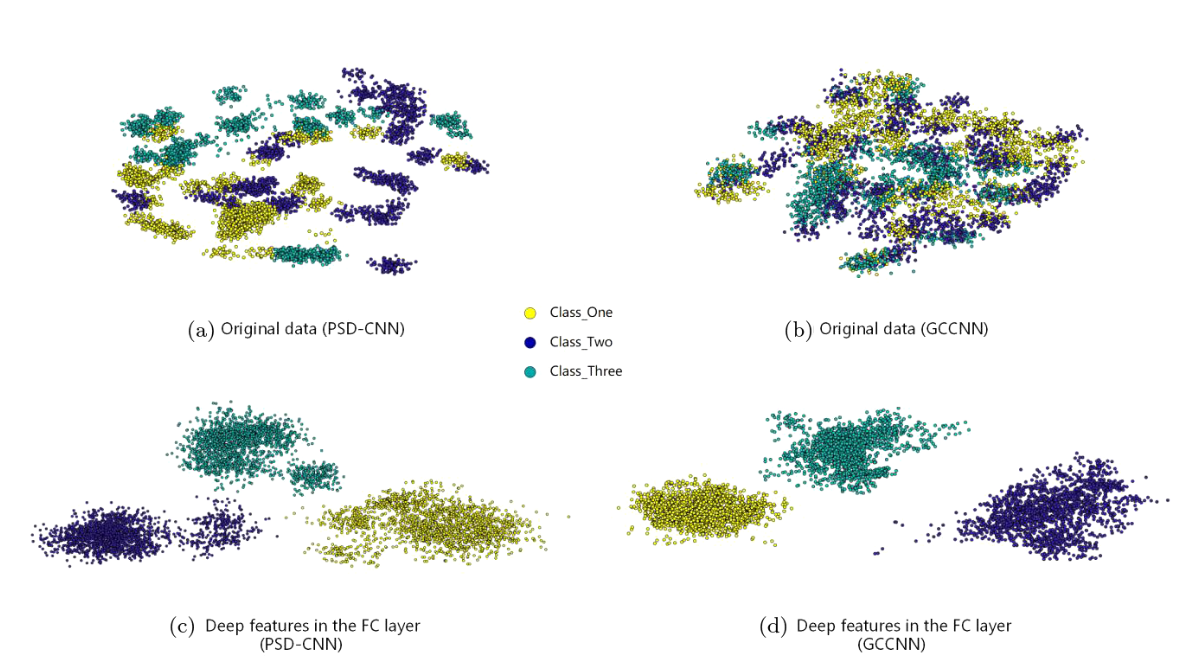
To visualize the capability of the models to extract representative features the original data and the features in the fully-connected layer have been plotted using t-distributed stochastic neighbor embedding[4][5]. The results can be seen in Figure 6 on the right, were both networks successfully extract easily seperable features in the fully connected layers. The authors found that their model has a stronger expressive power and outperforms the PSD-CNN in all the comparisons.
Performance on new subjects
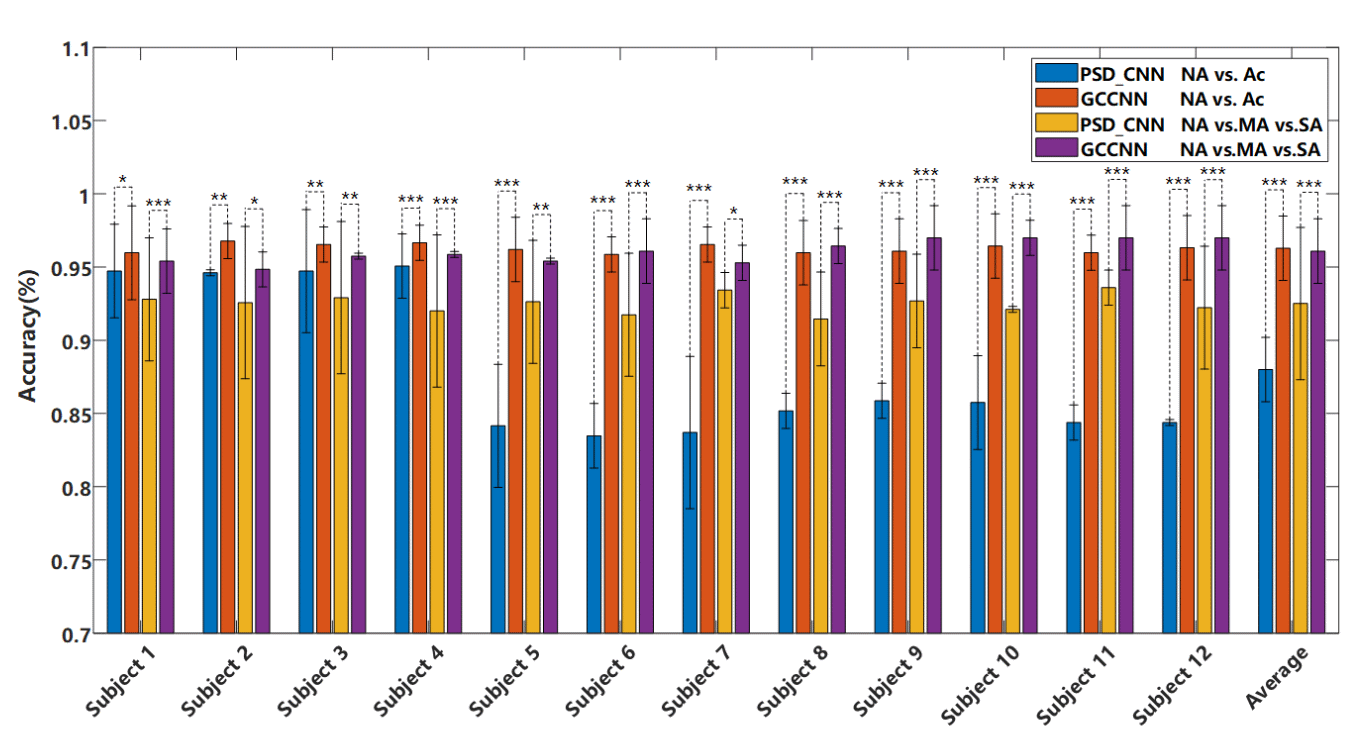
The authors model and the PSD-CNN was also applied to the data from the remaining 12 subjects (Figure 7) where results show that performance is very similar in some subjects for both models but very weak in others for the PSD-CNN model, while the authors model keeps performing well. The average accuracy on new subjects is over 94% for the authors method to determine if a person has acrophobia or not.
References
All Figures are directly taken from the paper [1:1].
Fo, Hu & Wang, Hong & Wang, Qiaoxiu & Feng, Naishi & Chen, Jichi & Zhang, Tao. (2020). Acrophobia Quantified by EEG Based on CNN Incorporating Granger Causality. International Journal of Neural Systems. 31. 10.1142/S0129065720500690. (publication) ↩︎ ↩︎
Y. Jiang, M. Duan, X. Chen, X. Zhang, J. Gong, D. Dong, H. Li, Q. Yi, S. Wang, J. Wang, C. Luo and D. Yao, Aberrant prefrontal–thalamic–cerebellar circuit in schizophrenia and depression: Evidence from a possible causal connectivity, Int. J. Neural Syst. 29(5) (2019) 1850032. ↩︎
X. Zhai, B. Jelfs, R. H. M. Chan and C. Tin, Selfrecalibrating surface EMG pattern recognition for neuroprosthesis control based on convolutional neural network, Front. Neurosci. 11 (2017) 379. ↩︎
Z. Jiao, X. Gao, Y. Wang, J. Li and H. Xu, Deep convolutional neural networks for mental load classification based on EEG data, Pattern Recognit. 76 (2018) 582–595. ↩︎
M. H. Rafiei and H. Adeli, A new neural dynamic classification algorithm, IEEE Trans. Neural Netw. Learn. Syst. 28(12) (2017) 3074–3083. ↩︎