Development of a ternary hybrid fNIRS-EEG brain–computer interface based on imagined speech
hybrid fNIRS_EEG BCI study
Development of a ternary hybrid fNIRS-EEG brain–computer interface based on imagined speech
This article is based on a paper with the same title
(Alborz Rezazadeh Sereshkeh, Rozhin Yousefi, Andrew T Wong, Frank, Rudzicz & Tom Chau (2019) Development of a ternary hybrid fNIRS-EEG brain–computer interface based on imagined speech, Brain-Computer Interfaces, 6:4, 128-140, DOI: 10.1080/2326263X.2019.1698928)
The idea of the described study was to record brain activity using two modalities electroencephalography (EEG) and functional near-infrared spectroscopy (fNIRS) and combine them in a hybrid classifier with improved accuracy. In the described experiment, subjects were asked to perform imagined speech, more specifically they were asked to do one of three tasks: mentally repeat the phrase “yes” or “no” in their mind; the third task was rest. The data was classified in one of these three classes.
Eventual goal
A lot of brain computer interface (BCI) research is done to eventually help people with motor impairments with enabling them communication with the outside world, since this would be an improvement in the quality of life for them[1]. Motor impaired people can still perform mental tasks, which is why BCI can be used. However, the activation tasks used in BCI experiments, have little correlation with typical communication[2], which makes the BCI data difficult to use in real world situations[3].
BCI activation tasks
Some of the activation tasks used in BCI experiments can be mental arithmetic, motor imagery or speech imagery. During mental arithmetic tasks, subjects would solve simple equations in their head, without writing them down. Motor imagery means subjects would imagine moving a part of the body, but they would not actually move it. This could be difficult for paraplegics, paralyzed people, or people who cannot move parts of their body for other reasons[4][5]. During imagined speech tasks, subjects would mentally repeat a phrase in their mind without moving their mouth[6]. This task in more correlated to the typical communication and is also used in the described study.
There have been different instructions in the previous studies involving imagined speech:
• mentally rehearse the phrase “yes” or “no” without any muscle and tongue movements[2:1][7]
• internally answer “yes” or “no”[8]
• think “yes” or “no” and avoid imagining the answer aurally or visually[9]
Another difference in the studies was presentation of the question, which needed to be answered – it could be presented visually or auditorily.
Different BCI imagined speech studies
There is an extensive review paper made on different BCIs used for imagined speech [10]. Experiments with imagined speech have been done in several languages (Chinese [11] and Spanish [12]), with vowels [3:1], syllables [13] and complete words [2:2]. For the use of BCI, the accuracy should be at least 70%, which was not achieved in those experiments. For classifying into classes “yes” and “no”, brain regions relating to language provided discriminatory information (the Broca’s area and the superior temporal gyrus) [2:3][3:2].
The hemodynamic response (recorded activity by fNIRS) is slow and for that reason, fNIRS was at first used to classify full sentences [14] instead of words [10:1]. Later it was used to differentiate between three classes “yes”, “no” and "rest" [15].
Comparison to previous hybrid fNIRS-EEG BCI studies
In the described study, the hybrid classifier was noticeably more accurate at three class classification than both unimodal classifiers (6.5 percentage points improvement), which is comparable to other (mostly two class classification) studies with hybrid BCIs [16][17][18][19]. One previous study with three class classification showed a much larger improvement compared to the fNIRS classifier, with the task during the experiment being motor imagery, mental arithmetic and idle state (3 different classes without imagined speech). The reason for that was that fNIRS detectors were placed only on the prefrontal cortex, while other brain regions were included in the task as well.
Described study
The study was done on eleven subjects, aged between 23 and 33 and had no health condition which would affect the experiment.
Table 1 describes the properties of both modalities used and Figure 1 shows the placement of EEG electrodes and fNIRS detectors and emitters. The fNIRS emitters and detectors were used in more than one channel, since it is only important that a pair of them is placed 3 cm apart and each emitter and detector can be used in more than one channel.
| EEG Data | fNIRS Data | |
|---|---|---|
| sensors - seen in Figure 1 | 32 dry electrodes | 16 emitters and 14 detectors |
| number of channels | 32 | 44 |
| sampling frequency | 1 kHz | 10 Hz |
| placement of sensors | all cortical regions, highest concentration in speech related regions | temporal, frontal, parietal cortices |
| notes | A1 and A2 electrodes – left and right earlobes as reference and ground | each source and detector were placed apart 3cm (Figure 1) |
| Fp1 and Fp2 electrodes – remove artefacts coming from eye movement signals - electrooculography (EOG) | Emitter: 2 laser diodes emitting light at wavelength 695 and 830 nm |
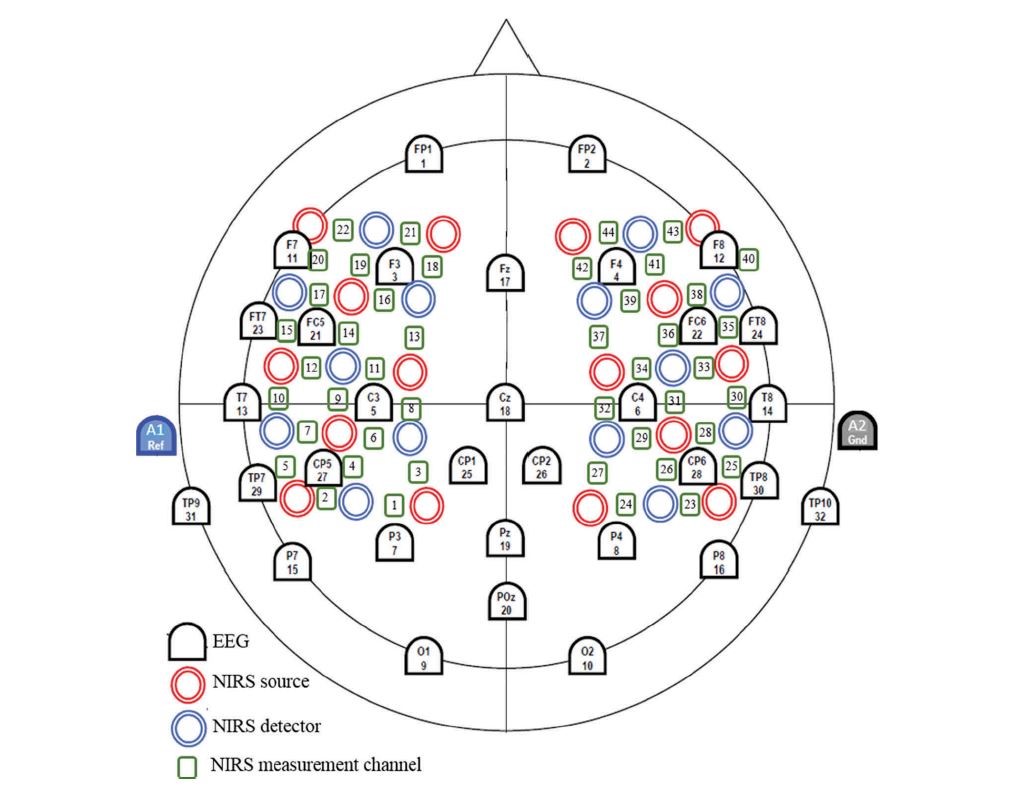
Figure 1: Placement of EEG electrodes and fNIRS detectors and emitters
Experiment
Each subject performed two sessions of the experiment on two separate days.
Task: subjects were told to either "rest" or mentally repeat the phrase “yes” or “no” in their mind as an answer to a question (3 different tasks). The phrase “yes” or ”no” was an answer to a visually presented question. During the "rest" trials, subjects were told not to repeat any phrase in their mind.
Trials: during each trial, subjects were told to do one of the three tasks, while the order was pseudorandom. Each trial lasted 15s and all tasks were presented an equal amount of times in each block.
Blocks: there were 3 blocks of trials in the first session and 4 blocks in the second session, which is presented in Table 2. The first block consisted of 36 trials and the other blocks consisted of 24 trials each as seen in Figure 2.
| training set | test set | |
|---|---|---|
| number of blocks | 4 | 3 |
| first session | 3 | 0 |
| second session | 1 | 3 |
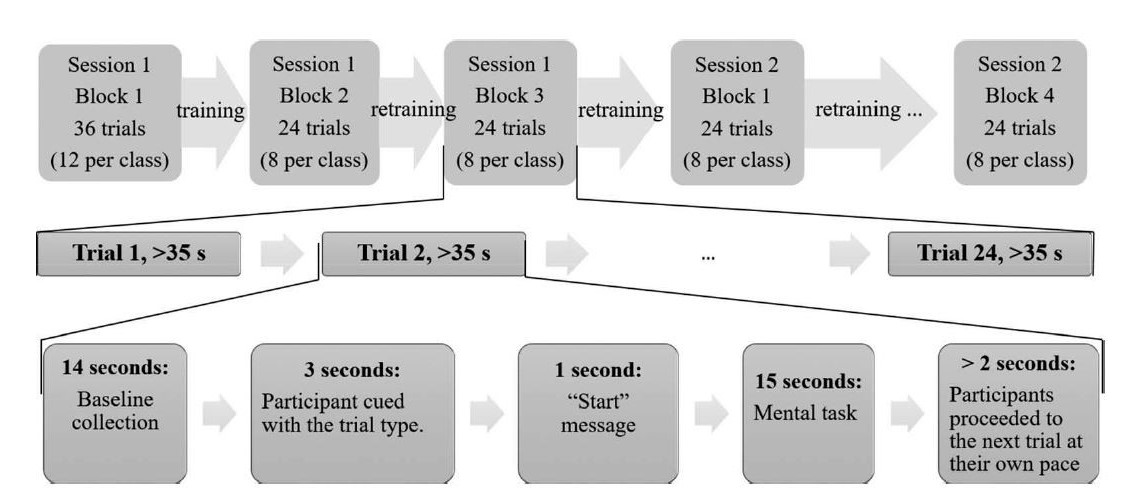
Figure 2: trials in blocks and sessions
"Rest" was chosen as the third class with the idea of implementing an accurate 3-class classifier as a binary switch, where "rest" would be used as a default state. This would be referred to as an asynchronous BCI, where a common default state would be "rest", and the two activation modes would be “yes” and “no”.
Feature extraction, classification methods and hyperparameters were selected from training data using 100 runs of 10-fold cross-validation (CV).
Classifiers in each of the test set blocks were trained with data from all the previous blocks (classifiers used in the last block were trained on more data than the classifiers used in the second-to-last block).
Data analysis
| EEG Data | fNIRS Data | |
|---|---|---|
| filter | 0.5<f<40 Hz bandpass | f<0.1 Hz lowpass |
| used feature | Discrete Wavelet Transform (DWT) | mean value of oxygenated hemoglobin concertation |
| other considered features | autoregressive components, common spatial patterns and spectral power estimates | variance, slope, kurtosis, skewness of changes in deoxygenated and oxygenated hemoglobin concentrations |
| signal processing | EOG removed using ADJUST algorithm[20] | baseline removal (subtracted channel average over 1.5 s before each trial) |
EEG data was separated in 6 frequency ranges : 1.0-2.0 Hz, 2.0-3.9 Hz, 3.9-7-8 Hz, 7.8-15.6 Hz, 15.6-31.3 Hz and 31.3-40 Hz. The most discriminatory frequency range of every channel was used as a feature, as described in the paragraph Discriminatory information below. Table 3 describes the data analysis of both used modalities.
Classification model and regularization parameter
One of the previous studies[21] concluded that the optimization of the parameters is more important than the choice of the model. Regularized Linear Discriminant Analysis (RLDA) (shrink LDA - BCI lectures) was used for this study.
The regularization parameters were calculated for each subject, each modality and each test block. The
\gamma *EEG=argmax(A0.05, A0.1,..., A1)\gamma *fNIRS=argmax(A0.05, A0.1,..., A1),
where A is accuracy of the average accuracy over 100 runs at given\gamma
Hybrid classifiers
Both EEG and fNIRS classifiers performed classification of each trial. The hybrid classification was determined either by the EEG or fNIRS classifier, using a probabilistic model. The decision depended on the accuracy of each classifier and the prior probability of a given class being in each feature vector.
The hybrid classifications were determined by equation 1. All 3 probabilities used in equation 1, were calculated by equations 2-4.
-
C(XEEG, XfNIRS) = argmax P(C=c|XEEG, XfNIRS); c= "yes", "no", "rest"
-
P(C="no"|XEEG, XfNIRS)=max(A*EEG x P(C="no"|XEEG), A*fNIRS x P(C="no"|XfNIRS)),
-
P(C="yes"|XEEG, XfNIRS)=max(A*EEG x P(C="yes"|XEEG), A*fNIRS x P(C="yes"|XfNIRS)),
-
P(C="rest"|XEEG, XfNIRS)=max(A*EEG x P(C="rest"|XEEG),A*fNIRS x P(C="rest"|XfNIRS)),
where XEEG, XfNIRS are feature vectors of each trial,
A*EEG and A*fNIRS are classification accuracies determined by optimized parameters,
Other possibilities of a fNIRS-EEG fusion model
Instead of fusing classifiers, data could be fused before classification. The problem some other studies[16:1] had with this approach, was overfitting because of increased dimensionality. In addition, normalization parameters had to be optimized for each subject, thus increasing the number of hyperparameters.
This study used classification of both unimodal classifiers in order to get hybrid classification. There was still a problem of overfitting on training data, which was solved by using 100 runs of 10-fold CV.
Classification accuracies
In Table 4 we can see accuracies for each test block for EEG, fNIRS and hybrid classifiers; Table 5 shows the same data, but for every subject specifically. We can see the hybrid classifier outperforming both unimodal classifiers.
| EEG classifier | fNIRS classifier | hybrid classifier | |
|---|---|---|---|
| accuracy | 64.8% ± 20.9% | 63.6% ± 21.1% | 70.5% ± 19.2% |
| exciding chance level (p < 0.001) | 6 subjects | 7 subjects | 9 subjects |
Classifier accuracies were compared using a two factor within-subject repeated measures ANOVA. The groups were compared (if they come from the same distribution) based on two factors: measurement device and block number. As measurement device factor, hybrid accuracies were compared to both unimodal accuracies. As the result, the hybrid classifier accuracy was significantly higher than both unimodal classifiers (p<0.05).
In Table 5 there are classification accuracies with hybrid classifier having the highest significance levels. Statistical significance levels were calculated by permutation test approach.
Table 5: Classification accuracy for each classifier and each subject, statistical significance levels of 0.05, 0.01, and 0.001 are marked with *, **, and *** (calculated using permutation test approach)
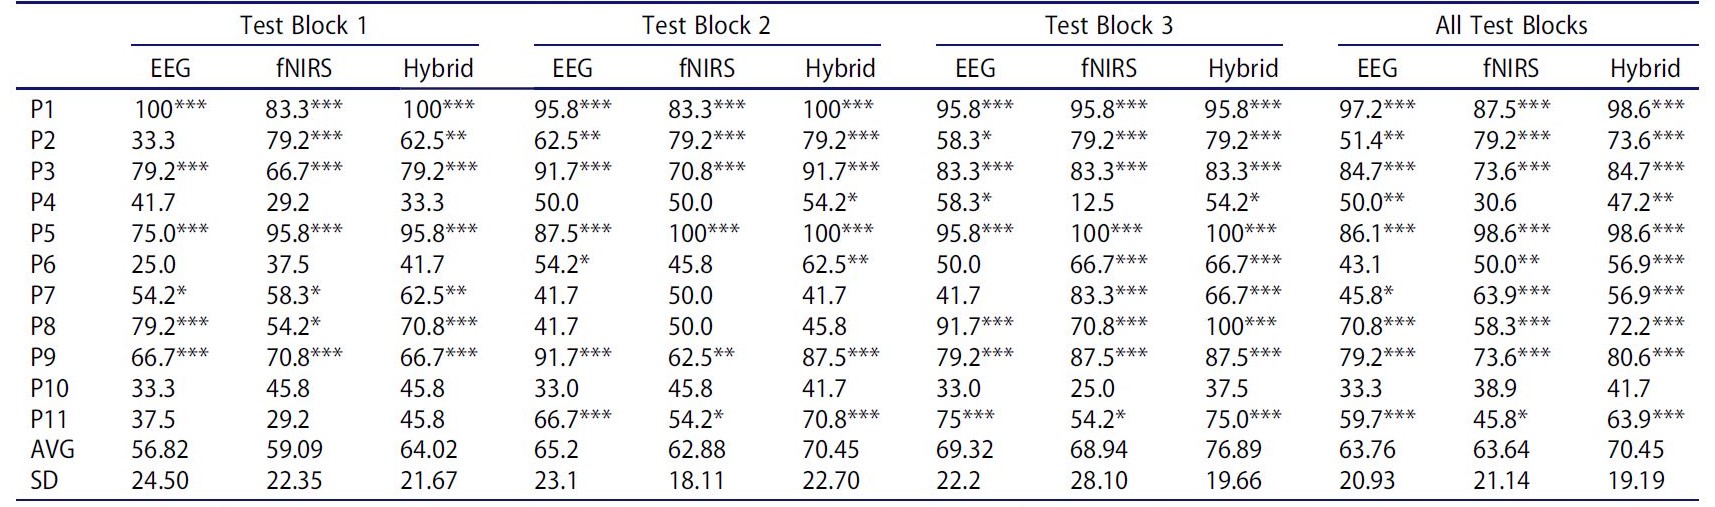
In Figure 3 we can see another representation of the data in Table 5 for all blocks. The accuracy for some subjects is noticeably lower than for others for all 3 classifiers. The hybrid classifier has the highest accuracy (or equal to the higher accuracy) for most subjects (8 out of 11).
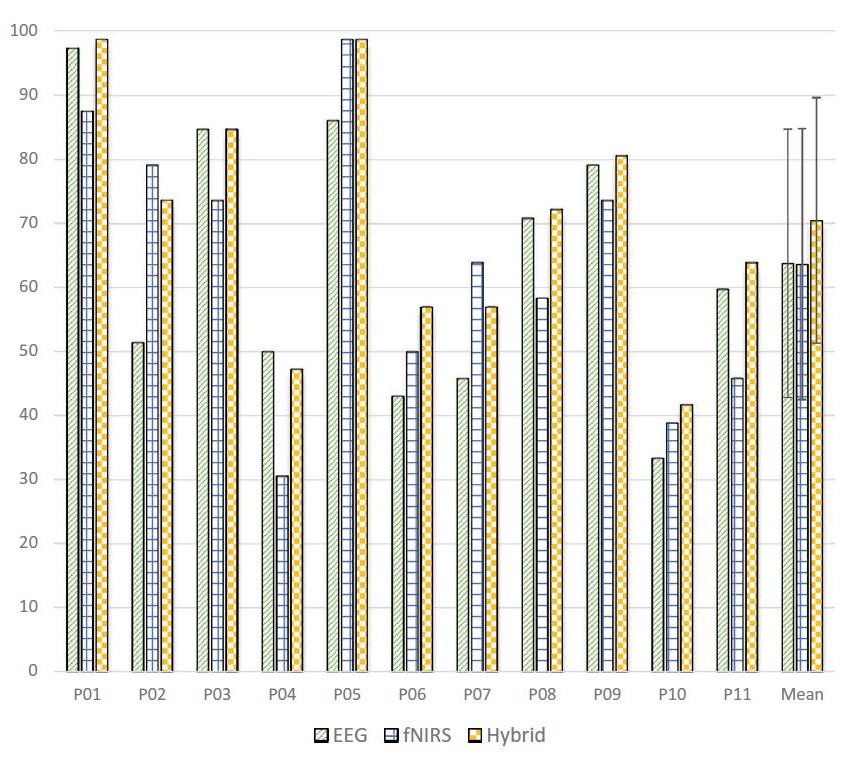
Figure 3: Classification accuracy for each classifier and each subject
Figure 4 shows accuracies for each test block for each classifier. The hybrid classifier has the highest accuracy in each test block and we can see that the average accuracy increases from first to the third test block, since the classifiers for third test block were trained on more data.
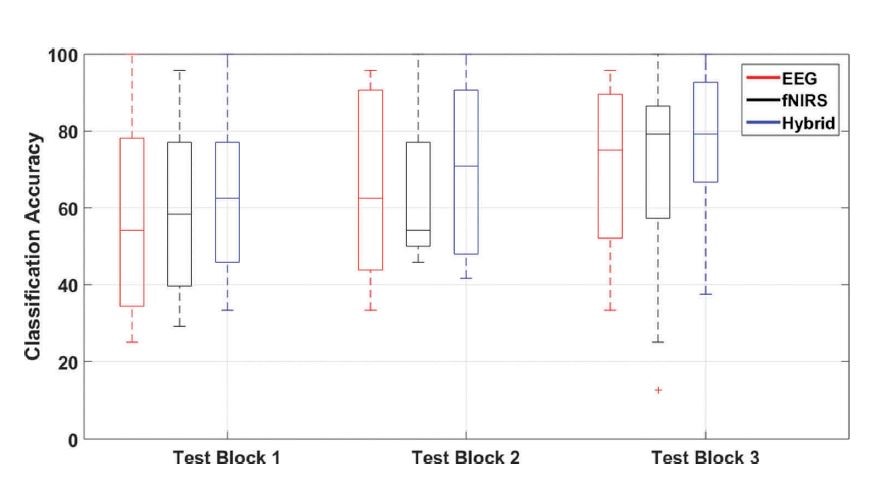
Figure 4: Classification accuracy across test blocks for each classifier
Modality contribution
For most subjects, one of the classifiers (EEG or fNIRS) had a noticeably higher contribution to the hybrid classifier. Figure 5 shows in how many trials each of the unimodal classifiers contributed to the hybrid classification. The difference is most noticeable at subjects 1, 3, 5, and 9. Otherwise both classifiers contributed to the hybrid classification, with a total of 64.7% contribution of the EEG classifier. The reason for that might be that EEG electrodes were placed on all of the brain regions, while fNIRS detectors were not.
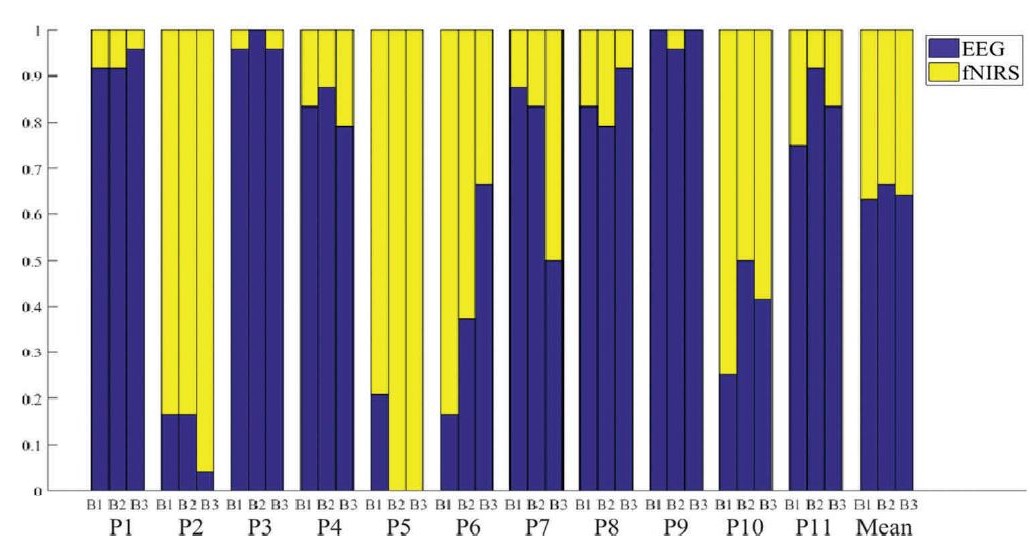
Figure 5: Modality contributions
Discriminatory information
To determine which frequency range of each EEG channel to use, Fisher criterion was used. The average and standard deviation of Fisher criterion of each channel across all test blocks and all subjects are shown in Figures 6 and 7. In Figure 6, higher number means more discriminative information. We can see that more discriminative information comes from higher frequency ranges.
We can see that a higher value in Figure 6 often corresponds to a higher value in Figure 7, which tells us that the highly discriminative regions are not the same for all subjects. The reason could be different shapes of brain regions between subjects and different activations of brain regions (for imagined speech) between subjects.
Most of the discriminative information from fNIRS data comes from the left temporal and temporoparietal regions, which was also shown by a previous study[15:1].
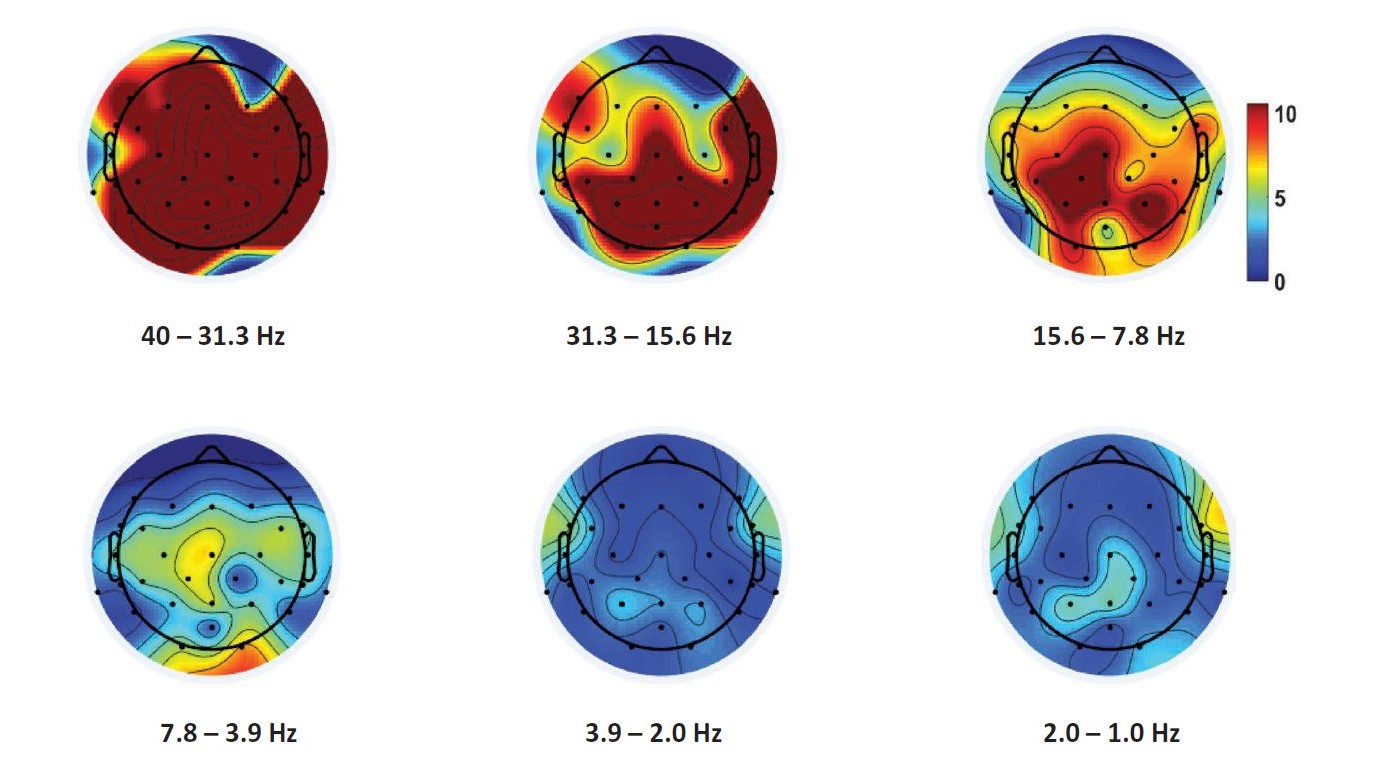
Figure 6: Mean of the Fisher criterion (across all test blocks and subjects) for each frequency range of EEG data
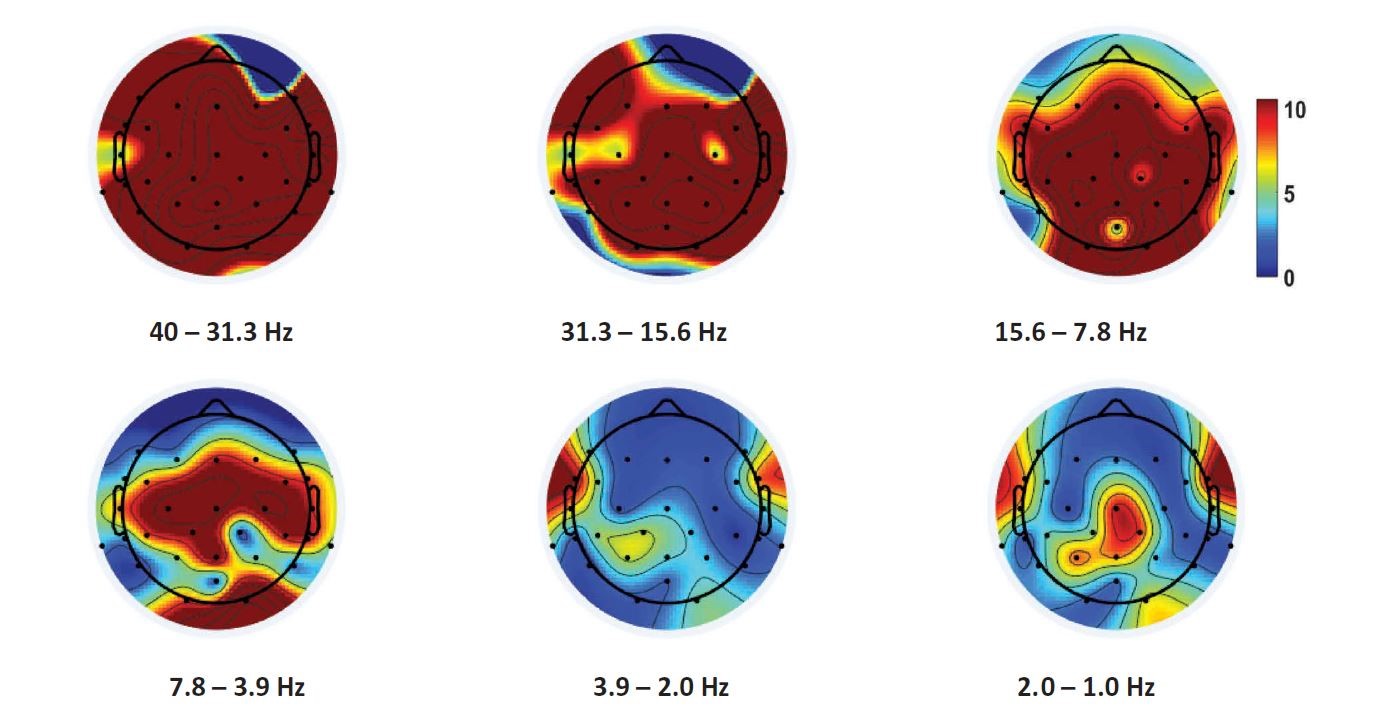
Figure 7: Standard deviation of the Fisher criterion
Information Transfer Rate (ITR)
The task in each trial lasted 15 s. In Figure 8, there is classification accuracy for trial duration from 8 s - 15 s. We can see that accuracy of all classifiers increases with time for at least 3 percentage points. The hybrid classifier shows the largest improvement (5 percentage points). Shortening trial duration means an improvement in ITR, since a high percentage of the final accuracy is already reached at trial duration of 8 s. Trials shorter than 8 s were not considered because of the slow nature of hemodynamic response, captured by fNIRS[22].
Some subjects have almost no improvement in accuracy with longer trial duration. In general, ITR could be improved if trial duration would be optimized for each subject (longer trial duration for those subjects, where accuracy is noticeably improved with longer trials).
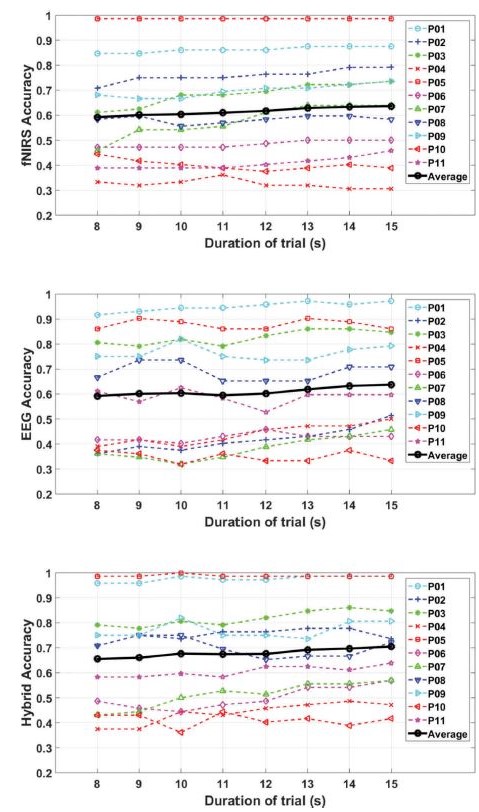
Figure 8: Classification accuracies for different trial durations
In this study, the ITR was calculated by the equation used in a previous study[23]:
ITR = 60/
where
In the following table, there are results from other similar studies. The first two used classification into two classes ("yes" and "no") while the third one used another class "rest". The reached ITR in this study is a lot higher than in other mentioned studies but the minimal ITR reached (considering mean and standard deviation) is lower.
| this study with three classes | a study with two classes[9:1] | a study with two classes[2:4] | a study with three classes[15:2] | |
|---|---|---|---|---|
| ITR (bits/min) | 2.03±1.84 | 1.06±0.25 | 0.94±0.12 | 0.94±0.83 |
Future studies
In the future, studies with more sessions could be done to have classifiers trained on more data. In this study, accuracy was increasing with each test block. With more sessions a maximum level of accuracy could be achieved, where more data would not increase the classifier performance any longer.
The proposed hybrid model could be further used on subjects, who would need it as a form of communication with outside world (people with long-term impairments). Some additional changes might be necessary before they could use it in every-day life.
References
Nicolas-Alonso LF, Gomez-Gil J. Brain computer interfaces,a review. Sensors. 2012;12(2):1211–1279. ↩︎
Sereshkeh AR, Trott R, Bricout A, et al. Online EEG classification of covert speech for brain–computer interfacing. Int J Neural Syst.2017;27(08):1750033. ↩︎ ↩︎ ↩︎ ↩︎ ↩︎
DaSalla CS, Kambara H, Sato M, et al. Single-trialclassification of vowel speech imagery using common spatial patterns. Neural Networks. 2009;22 (9):1334–1339. ↩︎ ↩︎ ↩︎
Cramer SC, Lastra L, Lacourse MG, et al. Brain motor system function after chronic, complete spinal cord injury. Brain. 2005;128(12):2941–2950. ↩︎
Conson M, Sacco S, Sarà M, et al. Selective motor imagery defect in patients with locked-in syndrome.Neuropsychologia. 2008;46(11):2622–2628. ↩︎
Schultz T, Wand M, Hueber T, et al. Biosignal-based Spoken Communication : A Survey. IEEE/ACM Trans Audio Speech Lang Process2015;14(8):1–15. ↩︎
Sereshkeh AR, Trott R, Bricout A, et al. EEG classification of covert speech using regularized neural networks. IEEE/ACM Trans Audio Speech Lang Process. 2017;25(12):2292–2300. ↩︎
Hwang H-J, Choi H, Kim J-Y, et al. Toward more intuitive brain–computer interfacing: classification of binary covert intentions using functional near-infrared spectroscopy. J Biomed Opt. 2016;21(9):091303. ↩︎
Chaudhary U, Xia B, Silvoni S, et al. Brain–computer interface–based communication in the completely locked-in state. PLoS Biol. 2017;15(1):1–26. ↩︎ ↩︎
Schultz T, Wand M, Hueber T, et al., Biosignal-based spoken communication: a survey. IEEE/ACM Trans Audio Speech Lang Process. 2017; 25:2257–2271 ↩︎ ↩︎
Wang L, Zhang X, Zhong X, et al. Analysis and classification of speech imagery EEG for BCI. Biomed Signal Process Control. 2013;8(6):901–908. ↩︎
Torres-García AA, Reyes-García CA, Villaseñor-Pineda L, et al. Implementing a fuzzy inference system in a multi-objective EEG channel selection model for imagined speech classification. Expert Syst Appl. 2016;59:1–12. ↩︎
Brigham K, Kumar BVKV, “Subject identification from Electroencephalogram (EEG) signals during imagined speech,” IEEE 4th International conference of biometrics theory, Appl Syst BTAS 2010, Washington, DC, 2010. ↩︎
Scholkmann F, Wolf M, Wolf U. The effect of inner speech on arterial CO2 and cerebral hemodynamics and oxygenation: A functional NIRS study Oxygen Transport to Tissue XXXV. In: S Van Huffel et al editors. Advances in experimental medicine and biology; vol 789; 2013. p. 81–7. BRAIN-COMPUTER INTERFACES 139 ↩︎
Sereshkeh AR, Yousefi R, Wong AT, et al. Online classification of imagined speech using functional near-infrared spectroscopy signals. J Neural Eng. 2018;16(1):016005. ↩︎ ↩︎ ↩︎
Fazli S, Mehnert J, Steinbrink J, et al. Enhanced performance by a hybrid NIRS-EEG brain computer interface. Neuroimage. 2012;59(1):519–529. ↩︎ ↩︎
Blokland Y, Spyrou L, Thijssen D, et al. Combined EEG-fNIRS decoding of motor attempt and imagery for brain switch control: an offline study in patients with tetraplegia. IEEE Trans Neural Syst Rehabil Eng. 2014;22(2):222–229. ↩︎
Morioka H, Kanemura A, Morimoto S, et al. Decoding spatial attention by using cortical currents estimated from electroencephalography with near-infrared spectroscopy prior information. Neuroimage. 2014;90:128–139. ↩︎
Shin J, Müller KR, Schmitz CH, et al. Evaluation of a compact hybrid brain-computer interface system. Biomed Res Int. 20172017;2017:1–11. ↩︎
Mognon A, Jovicich J, Bruzzone L, et al. ADJUST: an automatic EEG artifact detector based on the joint use of spatial and temporal features. Psychophysiology. 2011;48(2):229–240. ↩︎
Strother SC, Rasmussen PM, Churchill NW, et al. Stability and Reproducibility in fMRI Analysis. Pract Appl Sparse Model. 2012 (2009). ↩︎
Walsh B, Tian F, Tourville JA, et al. Hemodynamics of speech production: an fNIRS investigation of children who stutter. Sci Rep. 2017;7(1):1–13. ↩︎
Dornhege G, Del Millán JR, Hinterberger T, et al. Toward brain-computer interfacing. Neural Inf Process Ser. MIT press; 2007 (December 2014):507. ↩︎