closed-loop, music-based brain-computer interface for emotion mediation
closed-loop, music-based brain-computer interface for emotion mediation
This proof-of-concept system[1] was proposed by Ehrlich, Agres, Guan and Cheng in 2018. It uses a 14-channel Emotiv EPOC EEG[2] to measure the brains emotional state and plays fitting music using three instruments: piano, chello, and bass.
The emotional state is modeled by two variables called valance and arousal[3]. To further simplify the problem, only two contrary emotions sad (low value) and happy (high value) were used. This simplifies the control problem as both variables now share the same value eliminating the need for two regression predictors.
Procedural Music Generation
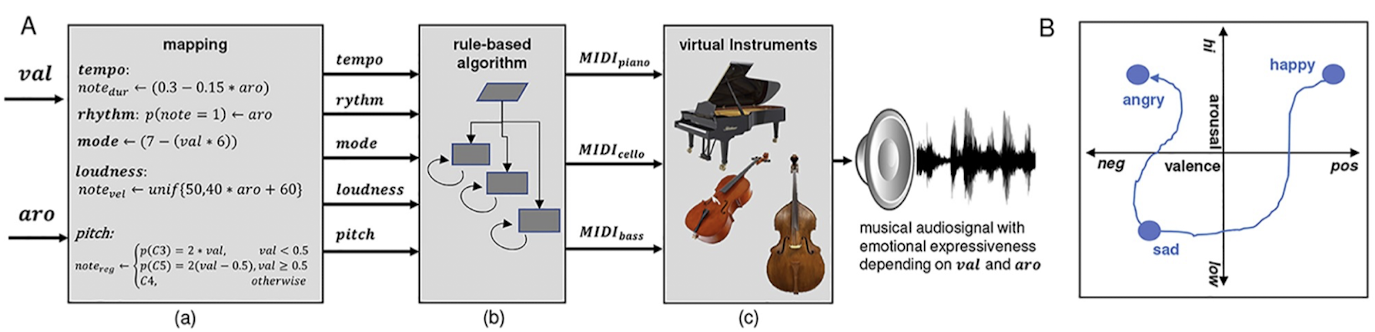
Fig. 1 Music Generator Overview[1:1]
The goal of this music generator is to create music with an exact emotion. This is modeled using a system proposed by Russel[3:1] which uses a two dimensional space to model every possible emotion. Using this model as input the generator should be able to create the any emotion.
The emotional inputs need to be translated into meaningful musical measures. This is done by using a subset of relationships found by Gomez and Danuser[4].
\textbf{tempo}:\ duration = 0.3 - arousal * 0.15 \;\;\;\;\;\;\;\;\;\;\;\;\;\;\;\;\;\;\;\;\;\;\;\;\;\;\;\;\;\;\;\;\;\;\;\;\;\;\;\;\;\;\;\;\;\;\;\;\; \\
\textbf{rhythm}:\ P(note = 1) = arousal \;\;\;\;\;\;\;\;\;\;\;\;\;\;\;\;\;\;\;\;\;\;\;\;\;\;\;\;\;\;\;\;\;\;\;\;\;\;\;\;\;\;\;\;\;\;\;\;\;\;\;\;\;\;\;\;\;\;\;\;\;\;\;\; \\
\textbf{loudness}:\ velocity = uniform\{50, 40*arousal + 60\} \subset \mathbb{N} \;\;\;\;\;\;\;\;\;\;\;\;\;\;\;\;\;\;\;\;\;\;\;\;\;\;\;\;\\
\textbf{pitch}:\ register =
\begin{cases}
    P(C3) = 2*valance,          & \text{if } valance\le -0.5\\
    P(C5) = 2 * (valance - 0.5) & \text{if } valance\geq 0.5 \\
    C4                          & \text{otherwise}
\end{cases} \\
\textbf{mode}:\ mode = 7 - 6 * valance \in \{1,2,...,7\} \;\;\;\;\;\;\;\;\;\;\;\;\;\;\;\;\;\;\;\;\;\;\;\;\;\;\;\;\;\;\;\;\;\;\;\;\;\; \\
The tempo is linked to the arousal value. With higher arousal, the duration of each note decreases, which increases the precieved tempo.
Rhythm is also determined by arousal. It increases the probability of a note being played. This creates rhythmically complexx pieces is the probability is somewere around
The last measure controlled by arousal is the loudness. This is sampled from the uniform distribution seen above. In summary, arousal is related to all measures independent of pitches.
Valance is used in register and mode.
Register determines how high the pitches are.
On the other hand, mode selects which chords are played. Kirchentonleitern were used to alternate the emotion of the chords. Each one, creates a distinct feeling. For example, Lydian sounds hopeful and Locrian sounds devilish. Ordered from high to low valance, they are as follows:
- Lydian
- Ionian
- Mixolydian
- Dorian
- Aeolian
- Phrygian
- Locrian
These measures are then passed into a rule-based algorithm to generate MIDI-event streams which are used to control software instruments to generate sound. Piano, cello, and bass are used because these are core components of a classical orchestra.
To ensure pleasant music, a few fixed rules were implemented. The fastest possible note was fixed to be an eight note and the key was set to C.
Brain Computer Interface
Calibration
Since only two different emotions are possible, the problem was modeled as a binary classification. For both classes and a neutral class (medium valance and arousal) different musical pieces were generated. The listener hears each part twice but the next excerpt is always randomly chosen from the other class. The neutral music was played to reduce the contrast between the two classes. Each excerpt was followed by a ten seconds idle period with silence. In total the calibration phase took about three minutes.
Classification pipeline
The data is processed in a ten step pipeline.
First the continuous EEG data is divided as the musical excerpts were presented.
Next, the parts are further split up into four second segments with a 87.5% overlap. Hence, a segment starts every 0.5 seconds.
Third, 2nd order zero-phase Chebyshev-IIR-bandpass filters were used to extract five frequency bands. The bands were selected based on standards found in (reference): 4-7Hz, 8-13Hz, 14-21Hz, 22-29Hz, and 30-47Hz.
Next, the log-variance was used to compute band power for each channel and frequency band.
Now, the idle period is used to compute a baseline-vector which is then subtracted from all the observations and the result standardized.
Then these processed observations were used to train a LDA-model to predict the emotion sad or happy.
Online Application
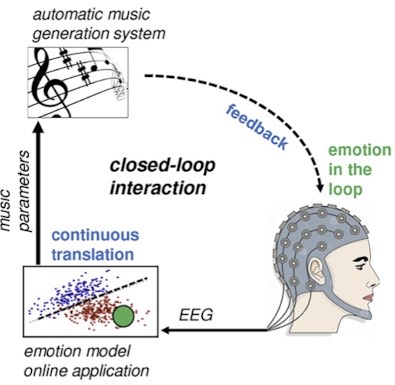
During application of the system, the constant baseline vector obtained from the calibration phase is used. To obtain a nicely scaled continuous variable, the LDA's output is passed through a logistic function
So music played by the music generator is heard by the listener. Using an EEG[2:1] to measure the brains reaction it is classified to be sad or happy. The LDA's result then alternates the played music which therefore closes the loop.
Studies
Listening Study
This study was targeted at confirming if the participants responses to the music are in line with the targeted valance and arousal values. This finding would confirm the music generators function. Four females and seven males took part in this first study. Out of this group, four had at least five years of musical education and all of them listened to music at least several days per week.
13 musical excepts of 30 seconds each generated by distinct uniformly distributed valance-arousal pairs got presented. Just like during the calibration, the order was equally pseudo-randomized. The music was played back through headphones of which the volume could be decided by the listener. Furthermore, the participants were told to keep their eyes closed.
At the end of each part, the person could take as much time as needed to provide feedback about his emotional response to the music using 9-point Self-Assessment Manikins.
Results
All participants showed different means in the self-assessment. Furthermore, arousal seamed to influence valance. If the first was high or low, the second was similarly adapted. On the other hand, arousal was almost independent of valance.
| target | ratings | |||
|---|---|---|---|---|
| No. | valance | arousal | valance | arousal |
| 1 | 0 | 0 | 0.12 |
0.30 |
| 2 | 0 | 0.5 | 0.30 |
0.51 |
| 3 | 0 | 1 | 0.29 |
0.95 |
| 4 | 0.25 | 0.25 | 0.39 |
0.25 |
| 5 | 0.25 | 0.75 | 0.58 |
0.67 |
| 6 | 0.5 | 0 | 0.23 |
0.23 |
| 7 | 0.5 | 0.5 | 0.50 |
0.52 |
| 8 | 0.5 | 1 | 0.69 |
0.80 |
| 9 | 0.75 | 0.25 | 0.74 |
0.29 |
| 10 | 0.75 | 0.75 | 0.79 |
0.68 |
| 11 | 1 | 0 | 0.73 |
0.29 |
| 12 | 1 | 0.5 | 0.62 |
0.45 |
| 13 | 1 | 1 | 0.67 |
0.83 |
Tab. 1 Targeted and rated valance and arousal values[1:2]
As seen in the table, for each of the valance-arousal pairs the standard deviation is quite high. It is hypothesized that this could be due to the vast cultural background of the participants, the small number of them, or different interpretations of the self assessment manikin. Due to this, the 9-point scale was normalized to be between 0 and 1 for each participant, valance, and arousal individually.
In general, the perceived arousal matches the desired one. Significant correlations between the ratings of the participants and the inputs to the music generator (p<0.05, using the pearson correlation) were found to be 5 out of 11 cases for valance and 8 out of 11 cases for arousal.
BCI Study
The goal of this study was to determine how well the participants were able to modulate the music to be happy or sad. Five males participated with one being musically educated. As well as in the previous study, all participants reported to regularly listen to music.
The setup was the same as in the first study. In addition, the participants were asked to rate their current mood on a seven point scale for 14 opposing emotions. No hints on how to modulate ones own emotional state were given as finding a way to do so was a sub-goal of this experiment.
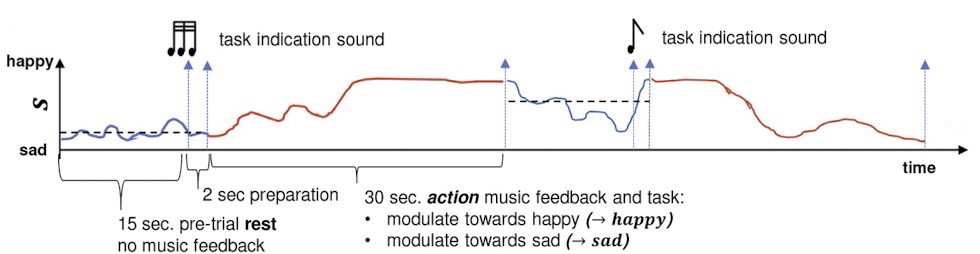
Fig. 3 Overview of the action period. The red lines indicate the modulation period and the blue the rest period. The arrows show changes in the periods.[1:3]
One epoch consists out of a 15 second rest/silence and a 30 second action period. These durations were chosen based on another study on emotion imagery by Sitaram et. al.[5] because this is the obvious method to modulate ones emotional state. Based on the average resting state, the opposing task was given by two distinct signal tones. If the participants rest phase was happy the modulate towards sad task was given. After giving the task two seconds passed until the action period began. The participants were ask to sit still, limit their movement and keep their eyes closed.
In total each listener participated in two session where the first one was around 15 minutes of emotion modulation with the main goal of becoming familiar with the setup. The second session took about one hour with 40 minutes of modulating. The rest of the time was spent filling out assessments. At the end, all of them were asked to formulate their modulation strategy into a short text.
Results
To evaluate the model obtained from the calibration phase a 10x10 cross validation was performed. The table shows the accuracy for the individual classes, the averaged accuracy, and the AUC for both sessions and each participant.
| S01 | S02 | |||||||
|---|---|---|---|---|---|---|---|---|
| Participant | happy | sad | ACC | AUC | happy | sad | ACC | AUC |
| P01 | 49.1% | 45.6% | 47.3% | 0.47 | 72.6% | 76.4% | 74.5% | 0.75 |
| P02 | 60.6% | 50.7% | 55.8% | 0.56 | 61.4% | 53.9% | 57.6% | 0.58 |
| P03 | 72.1% | 52.5% | 62.3% | 0.62 | 65.7% | 68.0% | 66.8% | 0.67 |
| P04 | 65.4% | 68.6% | 67.0% | 0.67 | 64.5% | 62.9% | 63.7% | 0.64 |
| P05 | 51.9% | 67.6% | 59.7% | 0.60 | 63.7% | 59.9% | 61.8% | 0.62 |
| Average | 59.8% | 57.0% | 58.4% | 0.58 | 65.6% | 64.2% | 64.9% | 0.65 |
Tab. 2 10x10 Cross Validation results for the classifier created from the calibration data[1:4]
The binary chance level based on a binomial inverse cumulative distribution with p<0.05 and 80 observations per participant is 58.75%. Therefore, for three out of five participants for session one and four out of five participants in session two the model reached a performance significantly higher than chance level. This increase could be related to the candidates becoming more familiar with the task. All participants reported usage of mental images to alternate their emotional state.
To further evaluate the gathered data, each action and rest period got averaged to obtain one individual score respectively. Even with the baseline correction using the vector determined during calibration, participants still developed a bias over time. A paired t-test with p<0.1 was used to test the maximal difference between action and rest period. Three out of the five participants created significant results on at least one of the two modulation tasks. Even thou the model of P01 (the only musically trained participant) received bad offline evaluation, the modulation performance was the best in both cases. Overall, everybody was able to modulate the music but it was only significant in some cases.
Modulation performance and self assessment
Person correlation was used to determine the correlation between the self assessment and the modulation performance. This shows that people achieved better modulation performance if they had a certain emotional state at the beginning of the experiment. For example, it was easier to modulate the music to be sad if the participant was concentrated or angry. On the other hand more neutral resting means were reached if the person was calm. Furthermore, a modulation towards happy was directly influenced by the tiredness of the participant.
Brain activity and emotion modulation
Analyses were done to further explore the oscillatory responses of the brain and link them to previously identified correlations between frequency bands and emotions. For example, modulation of alpha waves are associated with discrete emotions like happiness or sadness. Furthermore, these observations can be linked to the emotional model[3:2]. Changes in the beta band over the right temporal site is assumed to correlate with valance.
To validate if these changes could be observed in the gathered data, the significant epochs of the task modulate towards happy of the second session were used. For each trial, the band-power of all segments of the action period was calculated. Additionally, the mean of all resting periods was removed. The result is one observation for each trial. Then the data was standardized for each participant individually. To identify significant differences, t-tests were performed with p < 0.05/70 (the model has 70 features). This shows a significant power decrease in the beta band in the specified region and in the right hemisphere an increment in gamma band-power.
Still, these modulations could be rooted in hearing and processing the music and not in emotional response. So to further evaluate these modulations, a Granger causality analysis was performed. If the music influenced the brain activity, a unidirectional causality relationship from feedback to brain activity is expected. If the brain activity influenced the music, a relationship from brain activity to feedback should be seen. Only with bidirectional relations the brain and music generator truly interacted with each other. All features and the feedback score were used for the analysis resulting in a 71x71 matrix. Especially in the gamma activity over FC6, a bidirectional causal flow was calculated. This further supports previous analysis. But for the frontal beta modulation, no causal relationship were found. This suggests, that the observed activity is not linked to the music modulation task. Instead, it could indicate the participants concentrating on the task.
References
Ehrlich, Stefan K., et al. A closed-loop, music-based brain-computer interface for emotion mediation. PloS one 14.3 (2019): e0213516 ↩︎ ↩︎ ↩︎ ↩︎ ↩︎
Russell, J. A. (1980). A circumplex model of affect. Journal of Personality and Social Psychology, 39(6), 1161–1178. link ↩︎ ↩︎ ↩︎
Gomez, P., & Danuser, B. (2007). Relationships between musical structure and psychophysiological measures of emotion. Emotion, 7(2), 377–387. link ↩︎
Ranganatha Sitaram, Sangkyun Lee, Sergio Ruiz, Mohit Rana, Ralf Veit, Niels Birbaumer Real-time support vector classification and feedback of multiple emotional brain states NeuroImage Volume 56, Issue 2 (2011) Pages 753-765, link ↩︎